12.5. Event Recording#
The event recording support focuses on the recording of high frequency events such as
thread switches,
thread queue enqueue and surrender,
interrupt entry and exit,
heap/workspace memory allocate/free,
UMA zone allocate/free,
Ethernet packet input/output, and
etc.
There is a fixed set of 512 system reserved and 512 user defined events which
are identified by an event number (rtems_record_event).
The event recording support allows post-mortem analysis in fatal error handlers, e.g. the last events are in the record buffers, the newest event overwrites the oldest event. It is possible to detect record buffer overflows for consumers that expect a continuous stream of events, e.g. to display the system state changes in real-time.
The implementation supports high-end SMP machines (more than 1GHz processor
frequency, more than four processors). It uses per-processor ring buffers to
record the events. Synchronization is done without atomic read-modify-write
operations in the event production path. The CPU counter is used to get the
time of events. It is combined with periodic uptime events to synchronize it
with the monotonic system clock (CLOCK_MONOTONIC).
To use the event recording three things come into play. Firstly, there is the generation of event records on the target system (the application running with RTEMS). Secondly, means to transfer the recorded events to the host computer for analysis. Thirdly, the analysis of the recorded events on the host computer.
12.5.1. Target System: Configuration and Event Generation#
The application enables the event recording support via the application
configuration option CONFIGURE_RECORD_PER_PROCESSOR_ITEMS. The
application configuration option CONFIGURE_RECORD_EXTENSIONS_ENABLED
enables the generation of thread create, start, restart, delete, switch, begin,
exitted, and terminate events. This covers all threads of the system
throughout the entire application runtime. The application configuration
option CONFIGURE_RECORD_INTERRUPTS_ENABLED enables the generation of
interrupt entry and exit events. Dumps of the event records in a fatal error
handler can be enabled by the mutually exclusive
CONFIGURE_RECORD_FATAL_DUMP_BASE64 and
CONFIGURE_RECORD_FATAL_DUMP_BASE64_ZLIB application configuration
options.
Custom events can be recorded for example with the
rtems_record_produce(), rtems_record_line(),
rtems_record_caller(), etc. functions.
#include <rtems/record.h>

void f( void )
{
  rtems_record_produce( RTEMS_RECORD_USER( 0 ), 123 );
  rtems_record_line();
  rtems_record_caller();
}
The variants of rtems_record_line() and rtems_record_caller()
can be used to easily generate control flow events in the area of interest.
The rtems-record-lttng tool can use these events to associate source
code files and line numbers to them using the ELF file of the application.
The following code can be used together with the GCC option
-finstrument-functions to generate function entry/exit events for
instrumented functions:
__attribute__(( __no_instrument_function__ ))
void __cyg_profile_func_enter( void *this_fn, void *call_site )
{
  rtems_record_produce_2(
    RTEMS_RECORD_CALLER,
    (rtems_record_data) call_site,
    RTEMS_RECORD_FUNCTION_ENTRY,
    (rtems_record_data) this_fn
  );
}

__attribute__(( __no_instrument_function__ ))
void __cyg_profile_func_exit( void *this_fn, void *call_site )
{
  rtems_record_produce(
    RTEMS_RECORD_FUNCTION_EXIT,
    (rtems_record_data) this_fn
  );
}
12.5.2. Transfer of Event Records to the Host Computer#
The event records produced by the application on the target system need to be
transferred to a development host for analysis. For a running application on
the target system, this can be done through a TCP stream provided by the record
server on the target system. When the application on the target system
terminates, the latest event records can be dumped to the console device.
Custom record transfers can be done by using the rtems_record_dump() or
rtems_record_fetch() functions. Each processor has its own ring buffer
for event records. The ring buffer synchronization assumes that there is a
single producer and a single consumer. You cannot run the record server and a
dump or custom fetcher concurrently. The fatal error handler puts all other
online processors into an idle state, so it is safe to use a record server and
enable one of the fatal dump application configuration options.
Use the command line tool rtems-record-lttng to get recorded events
from the record server running on the target system or from a file to convert
the event records into CTF. It can be also used to read the dumps in Base64
encoding generated by a fatal error handler. The tool outputs the event
records in the Common Trace Format (CTF) with some
extra support for the Linux Trace Toolkit Next Generation (LTTng). This format can be analysed using babeltrace or Eclipse Trace Compass. The command line tool
rtems-record-lttng optionally uses LLVM to
translate addresses to functions and source file locations. Make sure you have
the LLVM development package installed when you build the RTEMS Tools to enable
this feature. The tool is installed by the RTEMS Source Builder.
12.5.2.1. Get the Event Records Through a TCP Stream#
Recorded events can be sent to a host computer through a TCP stream provided by
the record server running on the target system. The record server is started
by rtems_record_start_server() on the target system. To get the event
records from the record server use a command like this:
mkdir new-trace
rtems-record-lttng -e application.exe -H 192.168.188.84 -l 100000 -o new-trace
The -e option specifies the ELF file of the application and may be used to
translate addresses to functions and source file locations. The -H option
specifies the IPv4 address of the record server. The -l option limits the
data transfer size to 100000 bytes. Without the -l option, the tool runs
until it is stopped by a termination signal (for example Ctrl+C). The
-o option specifies a directory into which the CTF files created by the
tool are placed. This directory should be empty.
This command fetches the event records from the target and produces the CTF
files metadata, stream_0, stream_1, … for further
analysis placed into the new-trace directory:
$ ls -l
-rw-r--r-- 1 user group 108350 Nov 12 13:44 metadata
-rw-r--r-- 1 user group  24792 Nov 12 13:44 stream_0
-rw-r--r-- 1 user group  24225 Nov 12 13:44 stream_1
-rw-r--r-- 1 user group  24153 Nov 12 13:44 stream_2
-rw-r--r-- 1 user group  24447 Nov 12 13:44 stream_3
12.5.2.2. Get the Event Records Through a Fatal Error Handler#
Dumping the event records through a fatal error handler is enabled by the
mutually exclusive CONFIGURE_RECORD_FATAL_DUMP_BASE64 and
CONFIGURE_RECORD_FATAL_DUMP_BASE64_ZLIB application configuration
options.
In the fatal error handler, the event records can be dumped via
rtems_putc() in Base64 encoding. Optionally, the event records can be
compressed via zlib before they are dumped in Base64 encoding. The compression
needs roughly 512KiB of statically allocated memory.
A dump from the fatal error handler may look like this:
[... more output ...]
*** BEGIN OF RECORDS BASE64 ZLIB ***
eNqtlE1vE1cUhsdJWgg0jU2GABILpxUVkaJcTxzH8QqThKpRKTIJlcoyeIKIhGCCEFnAAtAoKgXa
phqx6gKk/AAXWHTpTMYZlg0rdpBdF7Dvsuec91jYFEo+HOnq0b33Oe/9mOtks9ns7Y1TK5ZlJah1
Uluw8HfJstqYA1b3WJG4a+p4aZpJbZzaXOlrw+4cte+p2Zcuz15kUstS3FhmZGiWOTs6nGM65Xye
6TqZEeZQNnOOWZh1y8KZfEHG3ewMszyE+XJ2hHNyg7lBrs9lhtIZpuMUHObR9LDwuxNnppgDufQ0
c2x6Ko35nLBcKOSEeXeYOXM+P8o8lR7oZ85dXJB1HDfN6+aGnbx4/YUR3t/+zgTfUaL3xMmJSe7v
0X7ameTzX9N7m6d7WyNetqyOI93HVgx7xKOWtTdJHOSc7rElo6TxrgvEQfHGbxkl/PFb8F/2GSX8
l33wX6WMEv6rlPjJ638YpfhE8ZM3Hhml+ETxUwdOG6X4RPFTB48bpfhE+E82jBL+kw34T9eNEv7T
dfH3leaNUnyi+PtOzxil+ET4r1NGCf91Cv6bhFHCf5MQv+fHR0YpPlH8njtLRik+UXz7iGOU4hPF
t7/qM0rxifCr60YJv7oOv/rX2aLVk1QetqvP5RFoP0N9/l2R95x/TG32SsTjo8Td4qE/0dDvFB/j
Z94zvqch58L/zO8ltqt3cxPeZ8QO9X/fgt9F/ETrqtuo+5z4qdb/vYP6bv7fZIcVyrFtInLCCnLC
CnLCCnLCCnLCCnLCCnLCSj0nSdytecUW5qX4/yyxt2gdGtD8b97p/2CHjy1dr3Hco3G8p/Bxm67f
OH+jYZ+N4/fes//G+YcfPN/qMrzVZfb+JMJbXYa3ulz3cA/N/otN+Li35rp/tlCH+26q3394G/X4
Xs05EzvIwXdvzvNakId3FAXIjQLOfUhEbhQgNwqQGwXIjQLkRgFyowC5UYDcKKjn4n1GD9qRX2c9
/91+fb0Pjdf38bH5+j436+l5aovwaz78mg+/5sOv+fBrvvo+zr/tOh/3tuN6H/feshwf36/leT7e
Q22xQ3LXrii9O5L/to/11jys9x/P+wnj3l3Zx0fnvXuyz0173n05z5Z972c5/7brvF/k3nZc7/0q
9x6fR07sIid2kRO7yIld5MQucmIXObGLnNjVHHdJvl/L89zf5D3E7rdF6+BV4knJf1b6Uuqelb7g
df4FFmd4DQ==
*** END OF RECORDS BASE64 ZLIB ***
[... more output ...]
Copy at least everything between the *** BEGIN OF RECORDS BASE64 ZLIB ***
and the *** END OF RECORDS BASE64 ZLIB *** markers into a file, for example
trace.txt. Use the following command to convert the event records into
the CTF files metadata, stream_0, stream_1, … for
further analysis placed into the new-trace directory:
mkdir new-trace
rtems-record-lttng -e application.exe -t trace.txt -o new-trace
If everything is set up correctly, then the command produces a metadata
file and one stream file stream_0, etc. for each processor which
generated event records:
$ ls -l
-rw-r--r-- 1 user group 108350 Nov 12 13:44 metadata
-rw-r--r-- 1 user group  24792 Nov 12 13:44 stream_0
-rw-r--r-- 1 user group  24225 Nov 12 13:44 stream_1
-rw-r--r-- 1 user group  24153 Nov 12 13:44 stream_2
-rw-r--r-- 1 user group  24447 Nov 12 13:44 stream_3
12.5.3. Analysis of Event Records on the Host Computer#
12.5.3.1. Analyse Event Records Using Babeltrace#
The CTF files created by the rtems-record-lttng tool can be processed
by babeltrace for further analysis, for example:
$ babeltrace new-trace
[07:28:15.909340000] (+?.?????????) RTEMS THREAD_STACK_CURRENT: { cpu_id = 0 }, { data = 0xB10 }
[07:28:15.909340000] (+0.000000000) RTEMS sched_switch: { cpu_id = 0 }, { prev_comm = "UI1 ", prev_tid = 167837697, prev_prio = 0, prev_state = 0, next_comm = "IDLE/0", next_tid = 0, next_prio = 0 }
[07:28:15.909519999] (+0.000179999) RTEMS THREAD_STACK_CURRENT: { cpu_id = 0 }, { data = 0xD68 }
[07:28:15.909519999] (+0.000000000) RTEMS sched_switch: { cpu_id = 0 }, { prev_comm = "IDLE/0", prev_tid = 0, prev_prio = 0, prev_state = 1026, next_comm = "UI1 ", next_tid = 167837697, next_prio = 0 }
[07:28:15.909579999] (+0.000060000) RTEMS THREAD_STACK_CURRENT: { cpu_id = 0 }, { data = 0xB10 }
...
[07:28:15.999940999] (+0.000000000) RTEMS USER_4: { cpu_id = 0 }, { data = 0x4000192C }
[07:28:15.999940999] (+0.000000000) RTEMS RETURN_0: { cpu_id = 0 }, { data = 0x0 }
[07:28:15.999940999] (+0.000000000) RTEMS RETURN_1: { cpu_id = 0 }, { data = 0x1 }
[07:28:15.999940999] (+0.000000000) RTEMS RETURN_2: { cpu_id = 0 }, { data = 0x2 }
[07:28:15.999940999] (+0.000000000) RTEMS RETURN_3: { cpu_id = 0 }, { data = 0x3 }
[07:28:15.999940999] (+0.000000000) RTEMS RETURN_4: { cpu_id = 0 }, { data = 0x4 }
[07:28:15.999940999] (+0.000000000) RTEMS RETURN_5: { cpu_id = 0 }, { data = 0x5 }
[07:28:15.999940999] (+0.000000000) RTEMS RETURN_6: { cpu_id = 0 }, { data = 0x6 }
[07:28:15.999940999] (+0.000000000) RTEMS RETURN_7: { cpu_id = 0 }, { data = 0x7 }
[07:28:15.999940999] (+0.000000000) RTEMS RETURN_8: { cpu_id = 0 }, { data = 0x8 }
[07:28:15.999940999] (+0.000000000) RTEMS RETURN_9: { cpu_id = 0 }, { data = 0x9 }
[07:28:15.999940999] (+0.000000000) RTEMS ISR_DISABLE: { cpu_id = 0 }, { code = "generate_events at init.c:154" }
[07:28:15.999940999] (+0.000000000) RTEMS ISR_ENABLE: { cpu_id = 0 }, { code = "Init at init.c:181" }
12.5.3.2. Analyse Event Records Using Trace Compass#
Install Eclipse Trace Compass to get
visualizations for the event records. Let us assume you have the trace data
available on your host in the new-trace directory:
ls -l new-trace
-rw-r--r-- 1 user group 108350 Nov 12 13:44 metadata
-rw-r--r-- 1 user group  24792 Nov 12 13:44 stream_0
-rw-r--r-- 1 user group  24225 Nov 12 13:44 stream_1
-rw-r--r-- 1 user group  24153 Nov 12 13:44 stream_2
-rw-r--r-- 1 user group  24447 Nov 12 13:44 stream_3
Start tracecompass and follow the steps below.
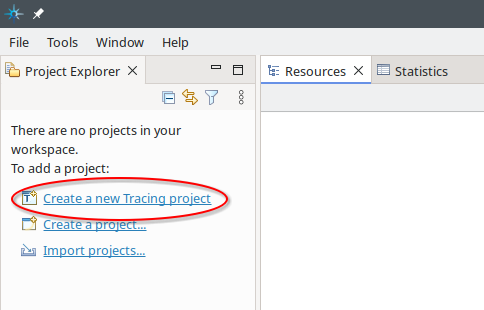
Fig. 12.1 After starting Trace Compass the first time, the Project Explorer tells you that there are no projects in your workspace. Select Create a new Tracing project. This will open the Tracing Project dialog box.#
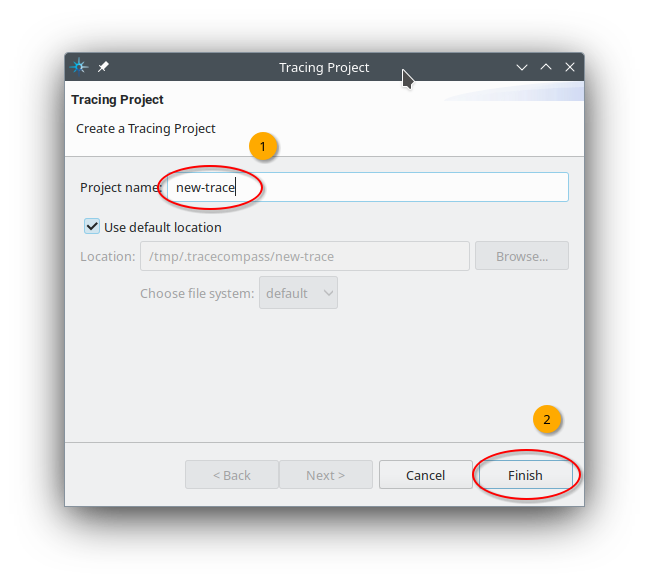
Fig. 12.2 In the Tracing Project dialog box, select a name for your tracing project. We select new-trace. Afterwards, continue with a click to Finish.#
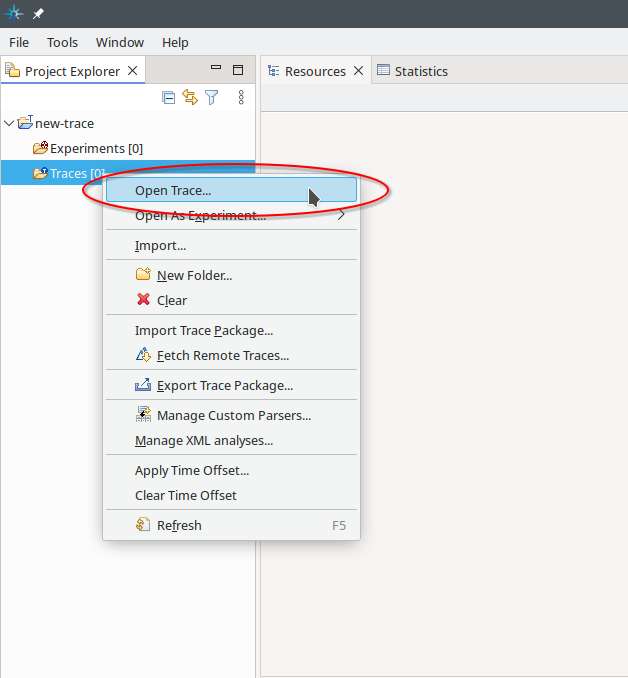
Fig. 12.3 Open the context menu of the Traces [0] folder and select Open Trace….#
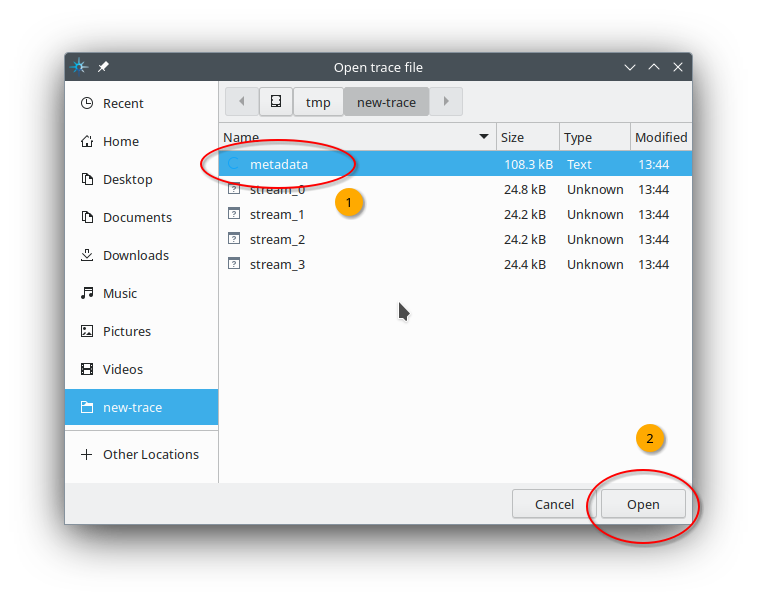
Fig. 12.4 Navigate to a directory containing the CTF files created by the
rtems-record-lttng tool. We select metadata located in
/tmp/new-trace. Afterwards, continue with a click to Open.#
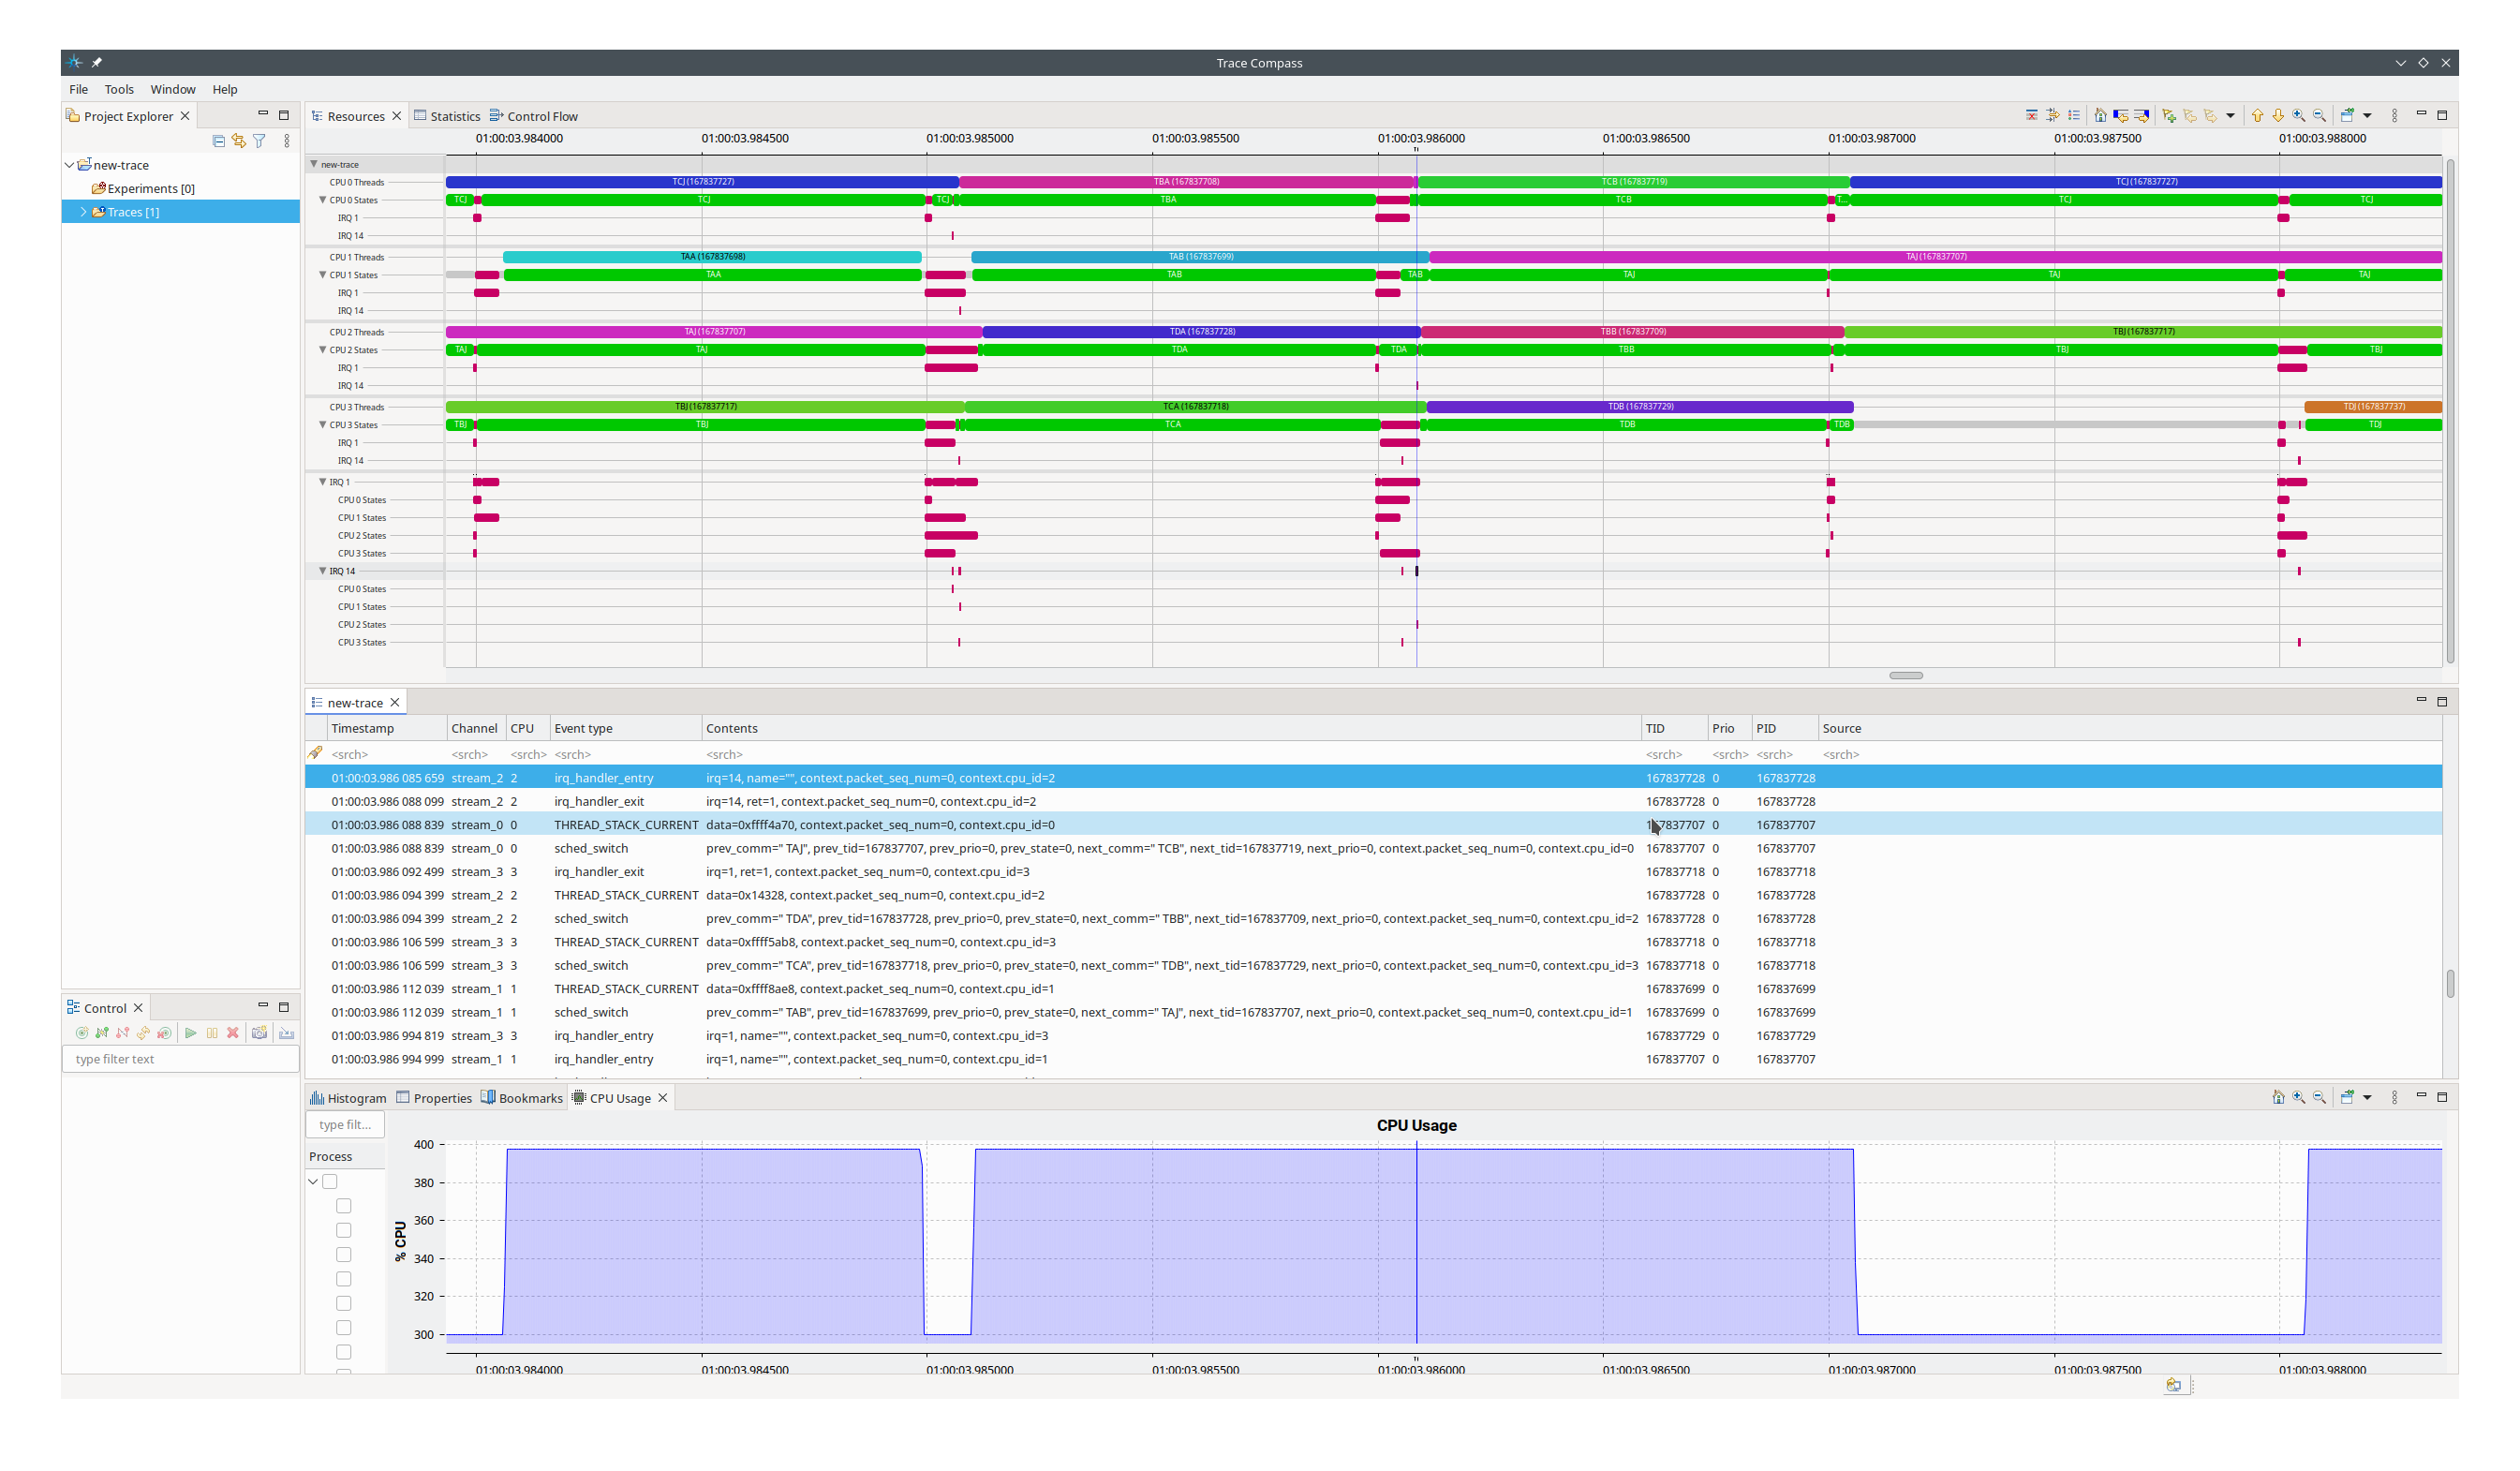
Fig. 12.5 Once a trace is opened, the main window shows you a couple of views, for example Resources, the trace log, and CPU Usage. The Resources view shows you the CPU utilization at a given time. A CPU may be idle, executing a thread, or executing an interrupt. The selected trace item in the trace log is shown as a vertical time bar in the Resources and CPU Usage view.#
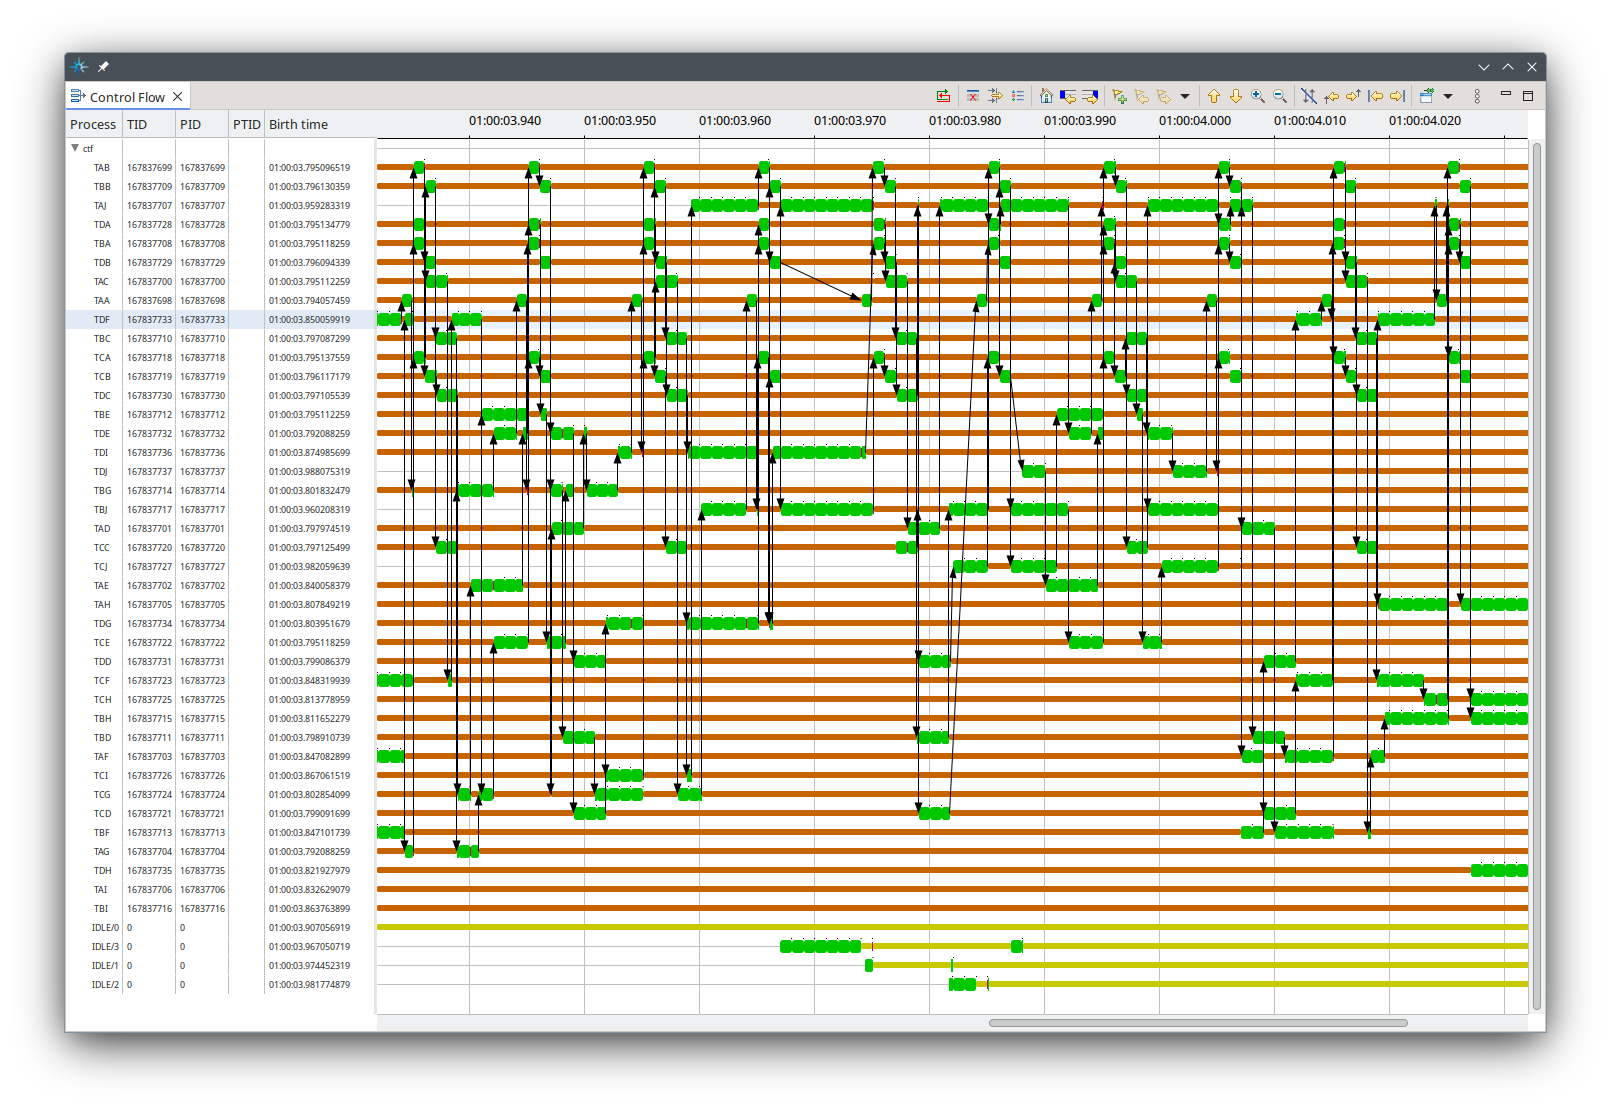
Fig. 12.6 The Control Flow view shows which threads execute when on which CPU. The arrows indicate thread switches.#
