10.1. Debugging with GDB#
To add support for auto-loading pretty-printing scripts for GDB in RTEMS, a small section containing a Python script is added to all executable files. This section is responsible for registering the pretty-printers provided by GCC and all RTEMS pretty-printers, and is automatically loaded and run each time you load an executable file into GDB.
In order for GDB to be able to execute this Python script each time you load an executable, a certain “safe-path” needs to be configured accordingly, to let GDB know which paths it is okay to run these scripts from. Not configuring this path properly can cause GDB to emit warnings such as this:
warning: File "executable" auto-loading has been declined by your `auto-load
safe-path' set to "$debugdir:$datadir".
There are many ways in which you can configure this path (or even choose not to), depending on how frequently you will be debugging applications.
- Suggested safe method
A less easy (but safer) way, would be to only add specific paths as safe to your
~/.gdbinitfile. For example, if you only use trusted applications in your/home/user/*directory, you can add it to the list of paths GDB counts as safe in your~/.gdbinitfile as follows:add-auto-load-safe-path /home/user
You can add any number of paths as trusted using this method.
- Lazy unsafe method
The easiest (and most unsafe) way is to add this line to your
~/.gdbinitfile:set auto-load safe-path /
Warning
This will allow GDB to run gdb-inlined scripts in any executable you load from any path. It is disabling a security feature within GDB, so use it at your own discretion and only load trusted executables in GDB.
- One time solution
If you are only going to be debugging an application a handful of times, you can utilise GDB’s command line options to do so. To enable auto-loading for your application for a single session only, you can invoke GDB like so:
gdb -iex "set auto-load safe-path /" executable
If you do not want to allow for these changes, and want to continue GDB without
pretty-printing support, adding the following line to ~/.gdbinit will
disable all forms of auto-loading and no pretty-printing will take place. It
will also suppress warnings that GDB emits with regards to auto-loading paths.
set auto-load no
10.1.1. Debugging with GDB and QEMU#
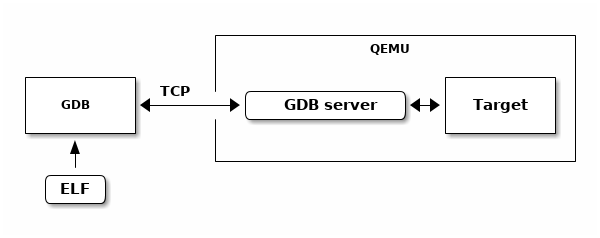
QEMU contains a debugging agent for the target being simulated. A QEMU command line option enables a GDB server, and the simulator manages the interaction with the target processor, its memory, and caches. The following diagram illustrates this setup:

Fig. 10.2 QEMU Executable Debugging#
We will be using the arm processor with the xilinx_zynq_a9_qemu BSP in
this example, but it can be generalised for any architecture/BSP pair.
10.1.1.1. Steps to Set Up Remote Debugging with QEMU#
- Start the Debug Agent (GDB Server) on the Target
The debug agent needs to be running on the target system, or in the case of a simulator like QEMU, it is started as part of the simulation.
qemu-system-arm -M xilinx-zynq-a9 -m \
    256M -no-reboot -serial \
    null -serial mon:stdio -nographic \
    -s
A brief summary of the options being used:
-M: machine type: xilinx-zynq-a9-m 256: 256 megabytes of memory for emulationno-reboot: prevents the machine from automatically rebooting after shutdown-serial null: serial port output is piped to /dev/null-serial mon:stdio: redirects serial monitor output through stdio-nographic: disables graphics-s: enables GDB to debug. The server is begun by default locally at port1234
- Connect GDB to the Debug Agent from the Host
On the host system, start GDB and connect it to the debug agent running on the target system
arm-rtems7-gdb sample_executable.exe
(gdb) target extended-remote <target-ip>:<port>
Replace
<target-ip>with the IP address of the target system and<port>with the port number where the GDB server is listening (e.g.,localhost:1234if using QEMU).
- Debugging commands
Once connected, the code needs to be loaded before it can be run.
(gdb) load
(gdb) break main
(gdb) continue
10.1.2. Debugging with GDB and OpenOCD#
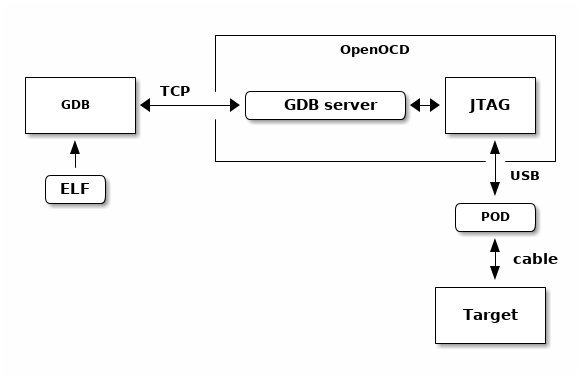
OpenOCD is a JTAG debugging tool that works with various JTAG devices. JTAG is a fast, low-level serial interface found in modern processors, allowing control over the core processing logic. The features of JTAG depend on the specific processor and architecture. Common functions include:
Processor control and register access
System level register access to allow SOC initialization
General address space access
Cache and MMU control
Break and watch points

Fig. 10.3 OpenOCD JTAG Executable Debugging#
10.1.3. Debugging with GDB and libdebugger#
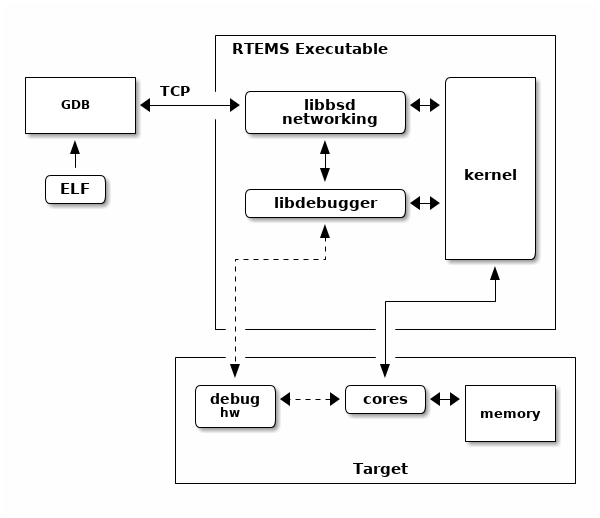
The RTEMS kernel has a debugging agent called libdebugger. This is a
software based agent that runs within RTEMS using network services to provide a
remote GDB protocol interface. A growing number of architectures are supported.
The RTEMS debugging agent is for application development providing thread aware
stop model debug experience.

Fig. 10.4 Libdebugger Executable Debugging#
