![]()
![]()
![]()
![]() RTEMS Remote Debugger Server Specifications
RTEMS Remote Debugger Server Specifications
To help the reader to understand what needs to be implemented, we will present briefly how GDB works regardless if the target is local or remote. A debugger is a tool which enables control of the execution of software on a target system. In most of cases, the debugger connects to a target system, attaches a process, inserts breakpoints and resumes execution. Then the normal execution is completely events driven (process execution stopped due to a breakpoint, process fault, single-step,...) coming from the debuggee. It can also directly access some parts of the target processor context (registers, data memory, code memory,...) and change their content. Native GDB debugger can just be seen as special cases where the host and the target are on the same machine and GDB can directly access the target system debug API.
In our case, the host and the target are not on the same machine and an Ethernet link is used to communicate between the different machines. Because GDB needs to be able to support various targets (including Unix core file, ...), each action that needs to be performed on the debuggee is materialized by a field of the following targets_ops structure :
struct target_ops
{
  char         *to_shortname;   /* Name this target type */
  char         *to_longname;    /* Name for printing */
  char         *to_doc;    /* Documentation.  Does not include trailing
                              newline, and starts with a one-line
                              description (probably similar to
                              to_longname). */
  void        (*to_open) PARAMS ((char *, int));
  void        (*to_close) PARAMS ((int));
  void        (*to_attach) PARAMS ((char *, int));
  void        (*to_detach) PARAMS ((char *, int));
  void        (*to_resume) PARAMS ((int, int, enum target_signal));
  int         (*to_wait) PARAMS ((int, struct target_waitstatus *));
  void        (*to_fetch_registers) PARAMS ((int));
  void        (*to_store_registers) PARAMS ((int));
  void        (*to_prepare_to_store) PARAMS ((void));

  /* Transfer LEN bytes of memory between GDB address MYADDR and
     target address MEMADDR.  If WRITE, transfer them to the target,
     else transfer them from the target.  TARGET is the target from
     which we get this function.

     Return value, N, is one of the following:

     0 means that we can't handle this.  If errno has been set,
     it is the error which prevented us from doing it (FIXME:
     What about bfd_error?).

     positive (call it N) means that we have transferred N bytes
     starting at MEMADDR.  We might be able to handle more bytes
     beyond this length, but no promises.

     negative (call its absolute value N) means that we cannot
     transfer right at MEMADDR, but we could transfer at least
     something at MEMADDR + N.  */

  int         (*to_xfer_memory)
                 PARAMS ((CORE_ADDR memaddr, char *myaddr,
                          int len, int write,
                          struct target_ops * target));

  void        (*to_files_info) PARAMS ((struct target_ops *));
  int         (*to_insert_breakpoint) PARAMS ((CORE_ADDR, char *));
  int         (*to_remove_breakpoint) PARAMS ((CORE_ADDR, char *));
  void        (*to_terminal_init) PARAMS ((void));
  void        (*to_terminal_inferior) PARAMS ((void));
  void        (*to_terminal_ours_for_output) PARAMS ((void));
  void        (*to_terminal_ours) PARAMS ((void));
  void        (*to_terminal_info) PARAMS ((char *, int));
  void        (*to_kill) PARAMS ((void));
  void        (*to_load) PARAMS ((char *, int));
  int         (*to_lookup_symbol) PARAMS ((char *, CORE_ADDR *));
  void        (*to_create_inferior) PARAMS ((char *, char *, char **));
  void        (*to_mourn_inferior) PARAMS ((void));
  int         (*to_can_run) PARAMS ((void));
  void        (*to_notice_signals) PARAMS ((int pid));
  int         (*to_thread_alive) PARAMS ((int pid));
  void        (*to_stop) PARAMS ((void));
  enum strata   to_stratum;
  struct target_ops
                *DONT_USE;      /* formerly to_next */
  int           to_has_all_memory;
  int           to_has_memory;
  int           to_has_stack;
  int           to_has_registers;
  int           to_has_execution;
  struct section_table
               *to_sections;
  struct section_table
               *to_sections_end;
  int           to_magic;
  /* Need sub-structure for target machine related rather than comm related? */
};
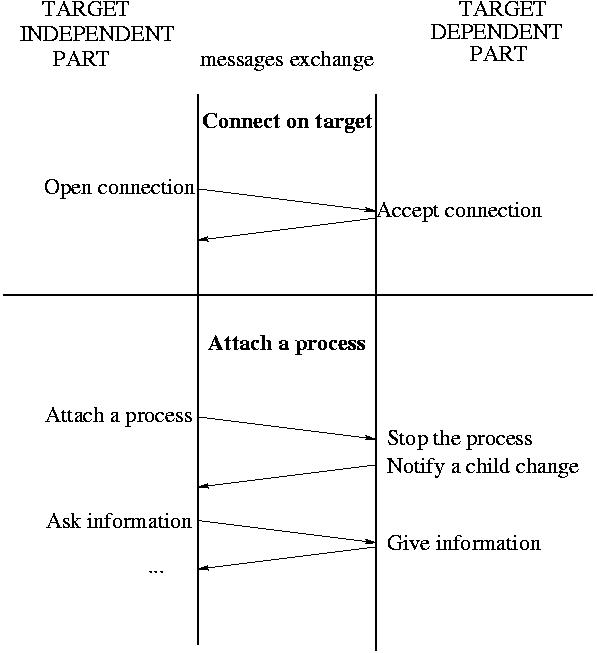
This structure contains pointers to functions (in C++, this would be called a virtual class). Each different target supported by GDB has its own structure with the relevant implementation of the functions (some functions may be not implemented). When a user connects GDB to a target via the ``target'' command, GDB points to the structure corresponding to this target. Then the user can attache GDB to a specific task via the ``attach'' command. We have therefore identified two steps to begin a remote debug session :
Figure Debug session initialization explains how the debugger connects to the target :
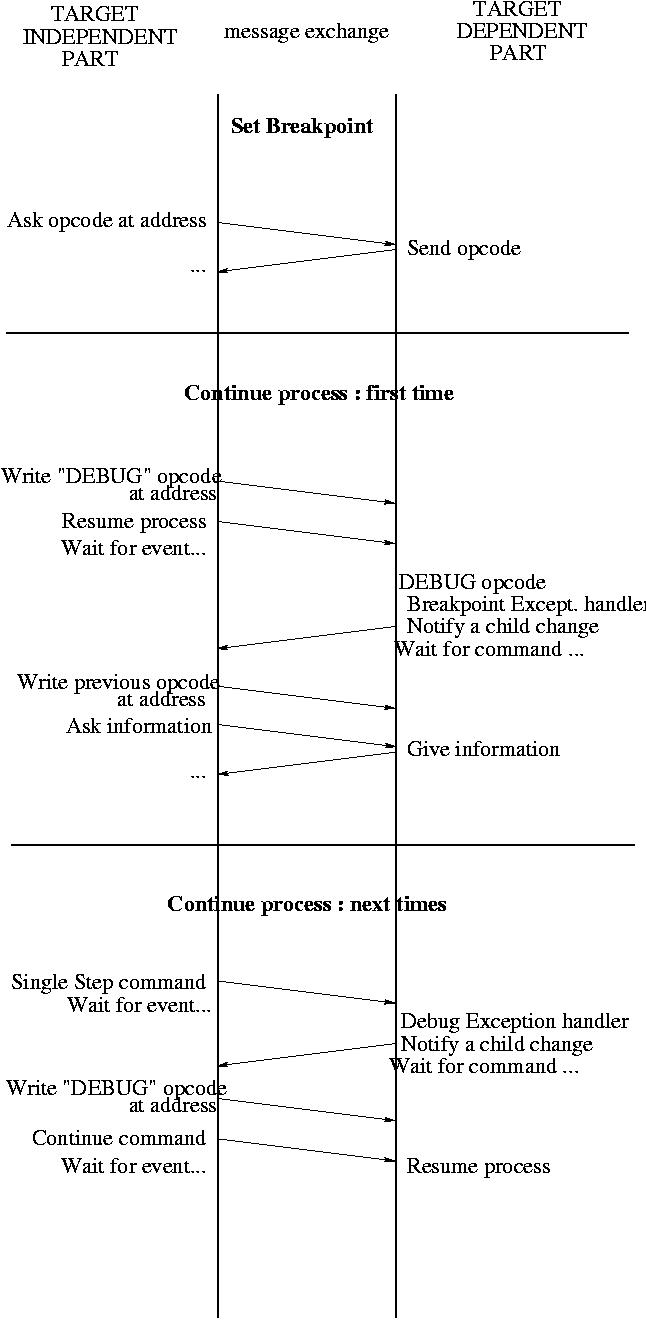
Figure Breakpoint and process execution explains how the debugger manages the breakpoints and controls the execution of a process :
Figure Breakpoint and process execution also shows the case of other ``CONTINUE'' commands (remember that the ``DEBUG'' opcode has been replaced by the right instruction):
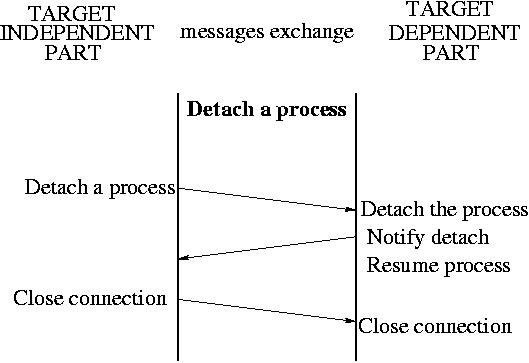
Figure Detach a process and close a connection explains how the debugger disconnects from a target :
![]()
![]()
![]()
![]() RTEMS Remote Debugger Server Specifications
RTEMS Remote Debugger Server Specifications
Copyright © 1988-2004 OAR Corporation